
When eBay switched off its paid search ads across 68 US metro areas for two months, sales barely moved. The measured effect was statistically indistinguishable from zero, because most of the revenue those ads seemed to drive would have arrived anyway (Blake, Nosko and Tadelis, a large-scale eBay field experiment published in Econometrica). The campaign still reported a return on ad spend. It just didn't have much of an effect.
That is the trouble with revenue and reported ROAS, the two numbers most stores watch hardest. Both can look healthy while the business underneath them is not. A store can grow its top line and lose money on every order, and it can post a strong reported ROAS on spend that changed almost nothing.
This is the framing piece for a series of evidence files on store economics. It covers the small set of numbers that tell you whether a Shopify store is healthy, and it points to the deeper post behind each one. Every claim below names its source.
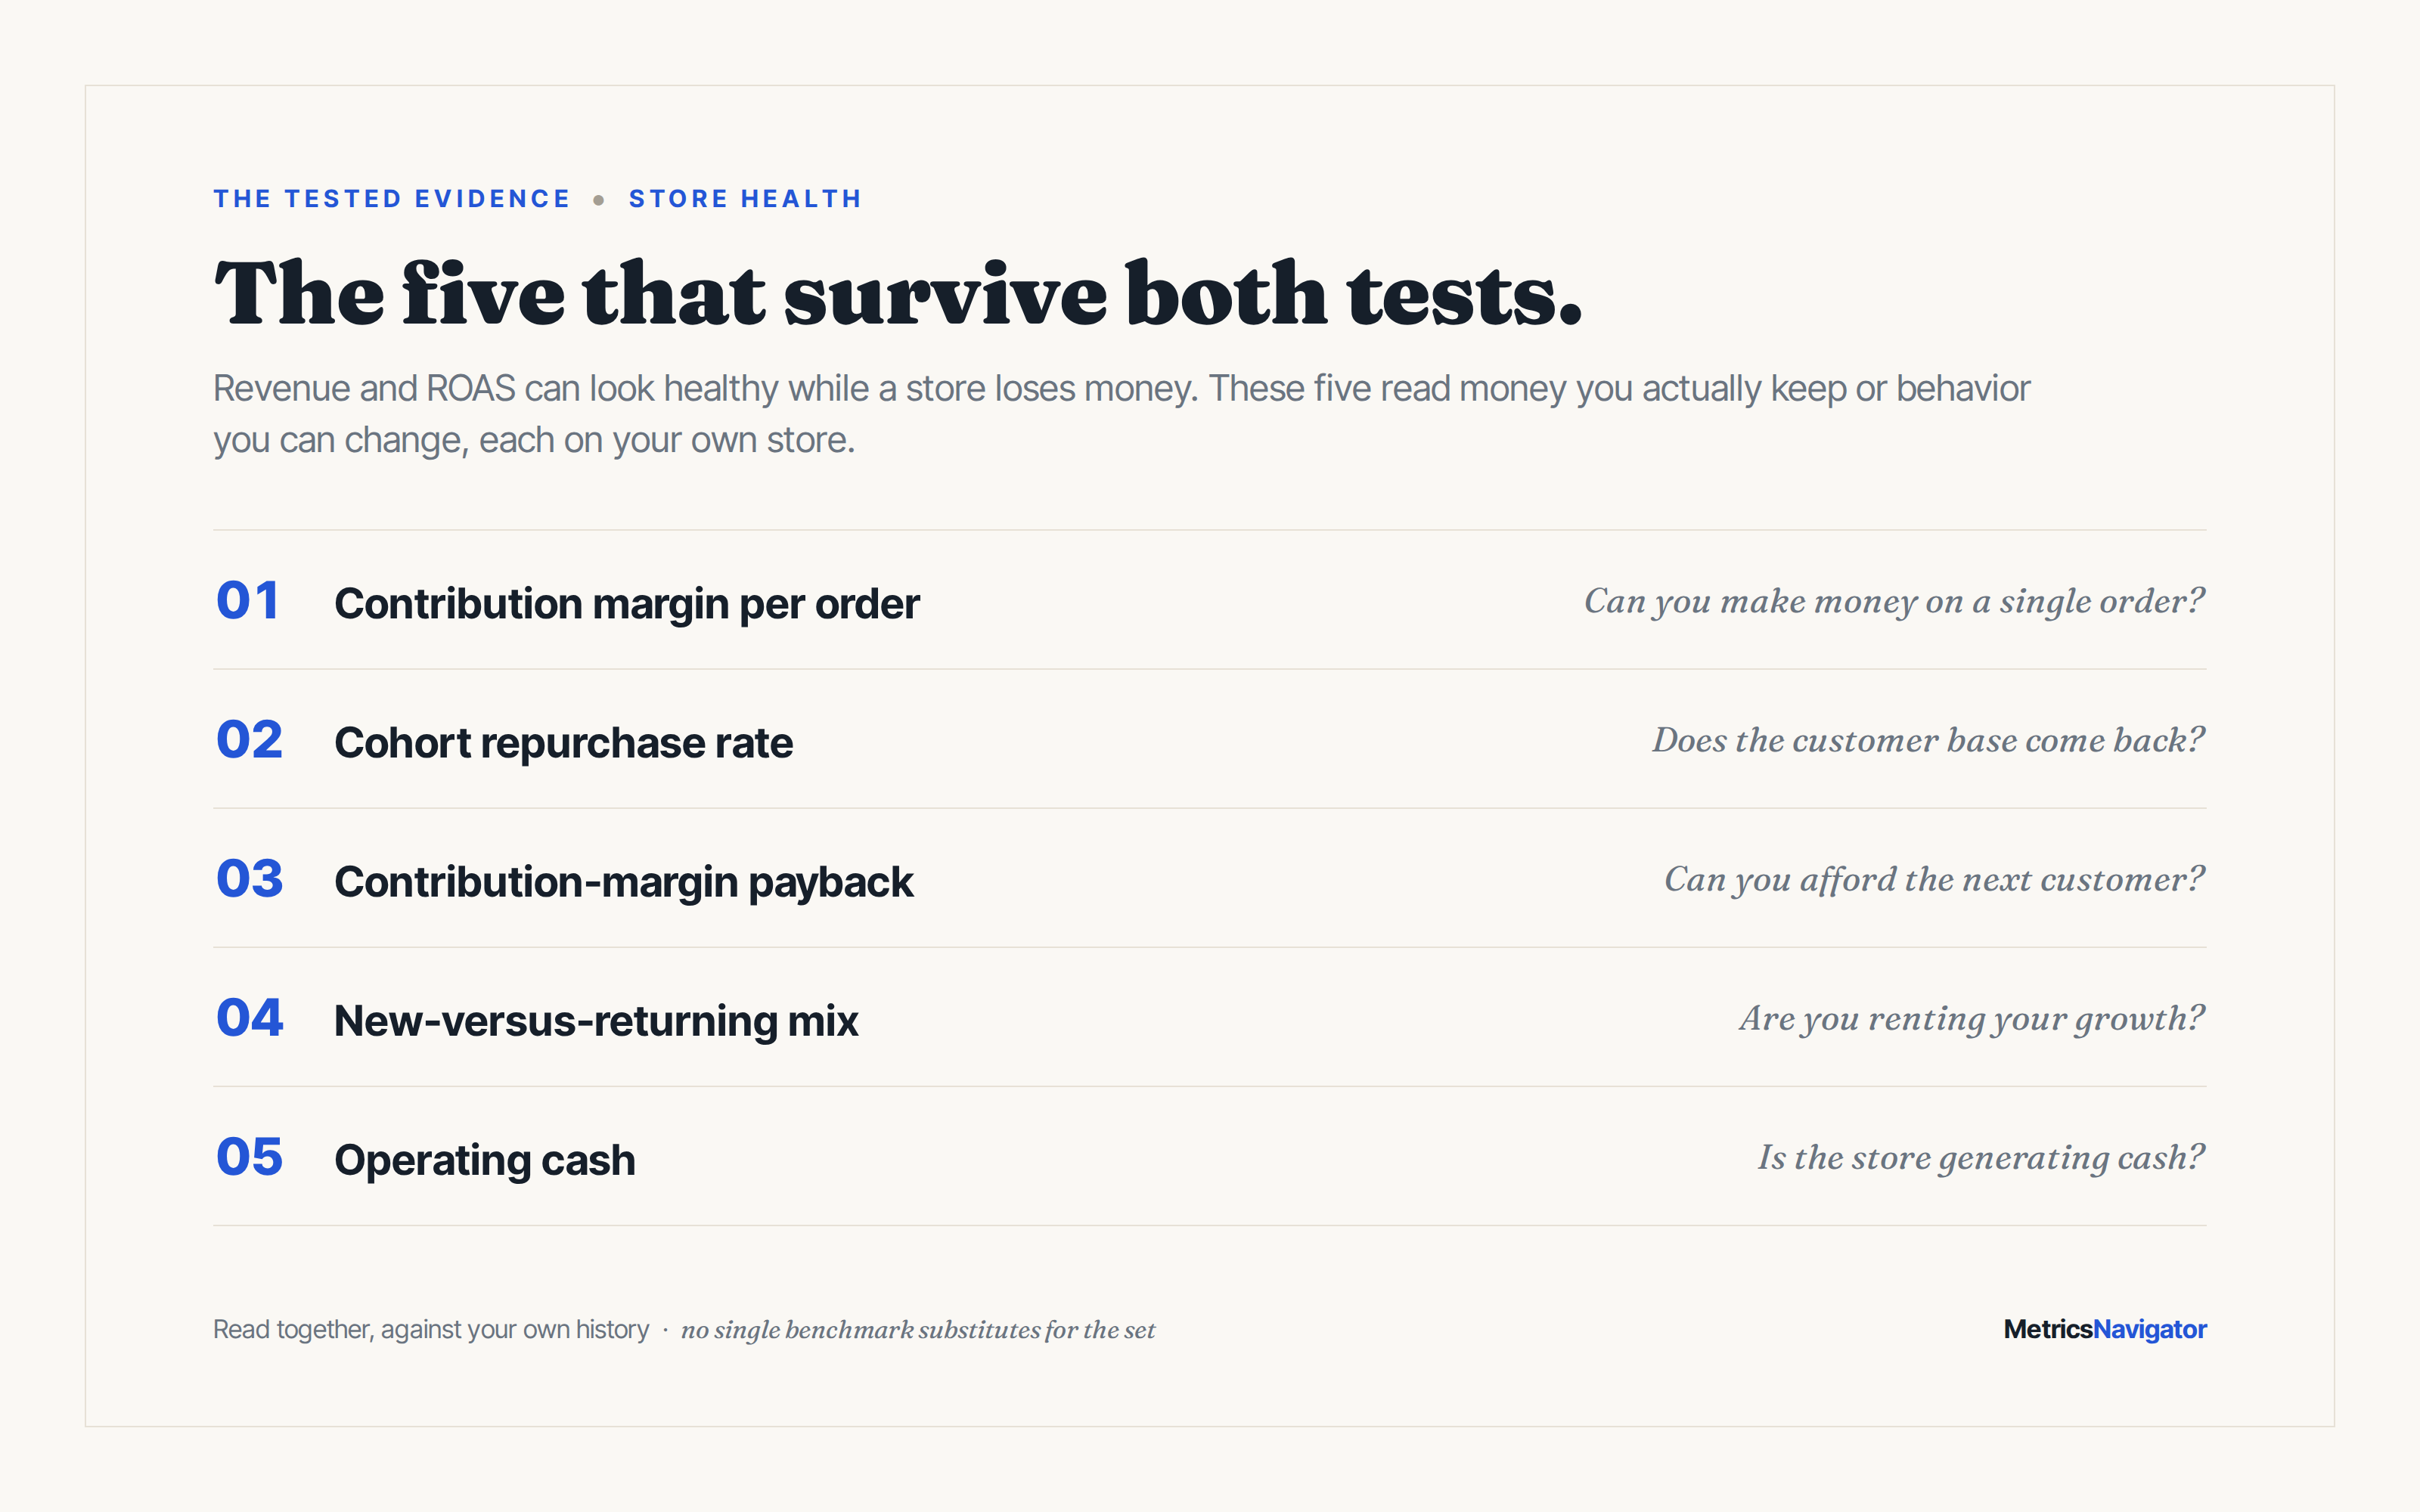
The short version: Revenue and ROAS can both look healthy while a store loses money and rents its growth. Five numbers tell you the truth instead: contribution margin per order, cohort repurchase rate, contribution-margin payback, the new-versus-returning revenue mix, and the operating cash the store generates. Read them together, on your own store, against your own history. No single benchmark substitutes for the set.
Two questions decide whether a number is worth watching: does it track money you keep, and can you do something about it. Revenue fails the first test, and reported ROAS often fails both.
The gap shows up in the filings. The median public DTC brand held a gross margin near 47% in FY2025 and still posted a −2.4% operating margin, across a 14-brand set of comparable SEC 10-Ks (Eightx, The State of DTC Profitability). The top line grew and the gross margin looked like a real product business. The money died below the gross line, in ad spend, fulfillment, returns, and overhead.
The numbers that pass are the ones this piece is about: contribution margin per order, cohort repurchase rate, contribution-margin payback, the new-versus-returning mix, and operating cash. Each is either money you keep or behavior you can change, and each is read on your own store rather than off a benchmark. Taken one at a time they can still mislead. Taken together they are hard to fake.
Contribution margin per order is the money left from one order after every cost that varies with it: product cost, payment processing, shipping and fulfillment, and the share of returns and discounts that order carries. It comes first because it is the floor. If it is negative, no amount of retention or scale saves the store, because every sale only digs the hole deeper.
Gross margin is not a substitute for it. A store can run a 47% gross margin and still lose money once fulfillment, returns, and variable marketing come out, which is the pattern in the public filings above. Returns alone are a controllable line most stores under-count: they run an estimated 19.3% of online sales industrywide (NRF, 2025 projection), and processing each returned item runs roughly $25 to $35 all-in for apparel (Eightx, 2026 modeled benchmark).
The order-level costs that erase contribution mostly sit outside the product itself, which is also where the room to fix them is. How to lift the number through thresholds, bundling, and shipping economics rather than blanket discounts is the subject of the average-order-value evidence file, and the full contribution-margin ladder, from CM1 down to what is left after marketing, sits inside the lifetime-value evidence file.
Repurchase rate is the share of a customer cohort that places a second order inside a fixed window. It answers whether the base is healthy or whether the store has to keep buying its growth. Across 156,110 DTC customers, only 18.8% placed a second order within 365 days, meaning about four in five never came back (BS&Co dataset). Category moves the number a lot: consumables land higher, durables far lower.
The common mistake is reading a single blended “returning customer rate” that mixes new cohorts with old ones. A cohort's retention rate tends to drift upward over time, but that rise is mostly survivor sorting: the high-churn customers leave first, so the survivors look more loyal without anyone changing behavior (Fader and Hardie, Journal of Interactive Marketing). Compare fixed cohorts at a fixed window instead, March against January, and the trend becomes real. The method is worked through in the retention evidence file.
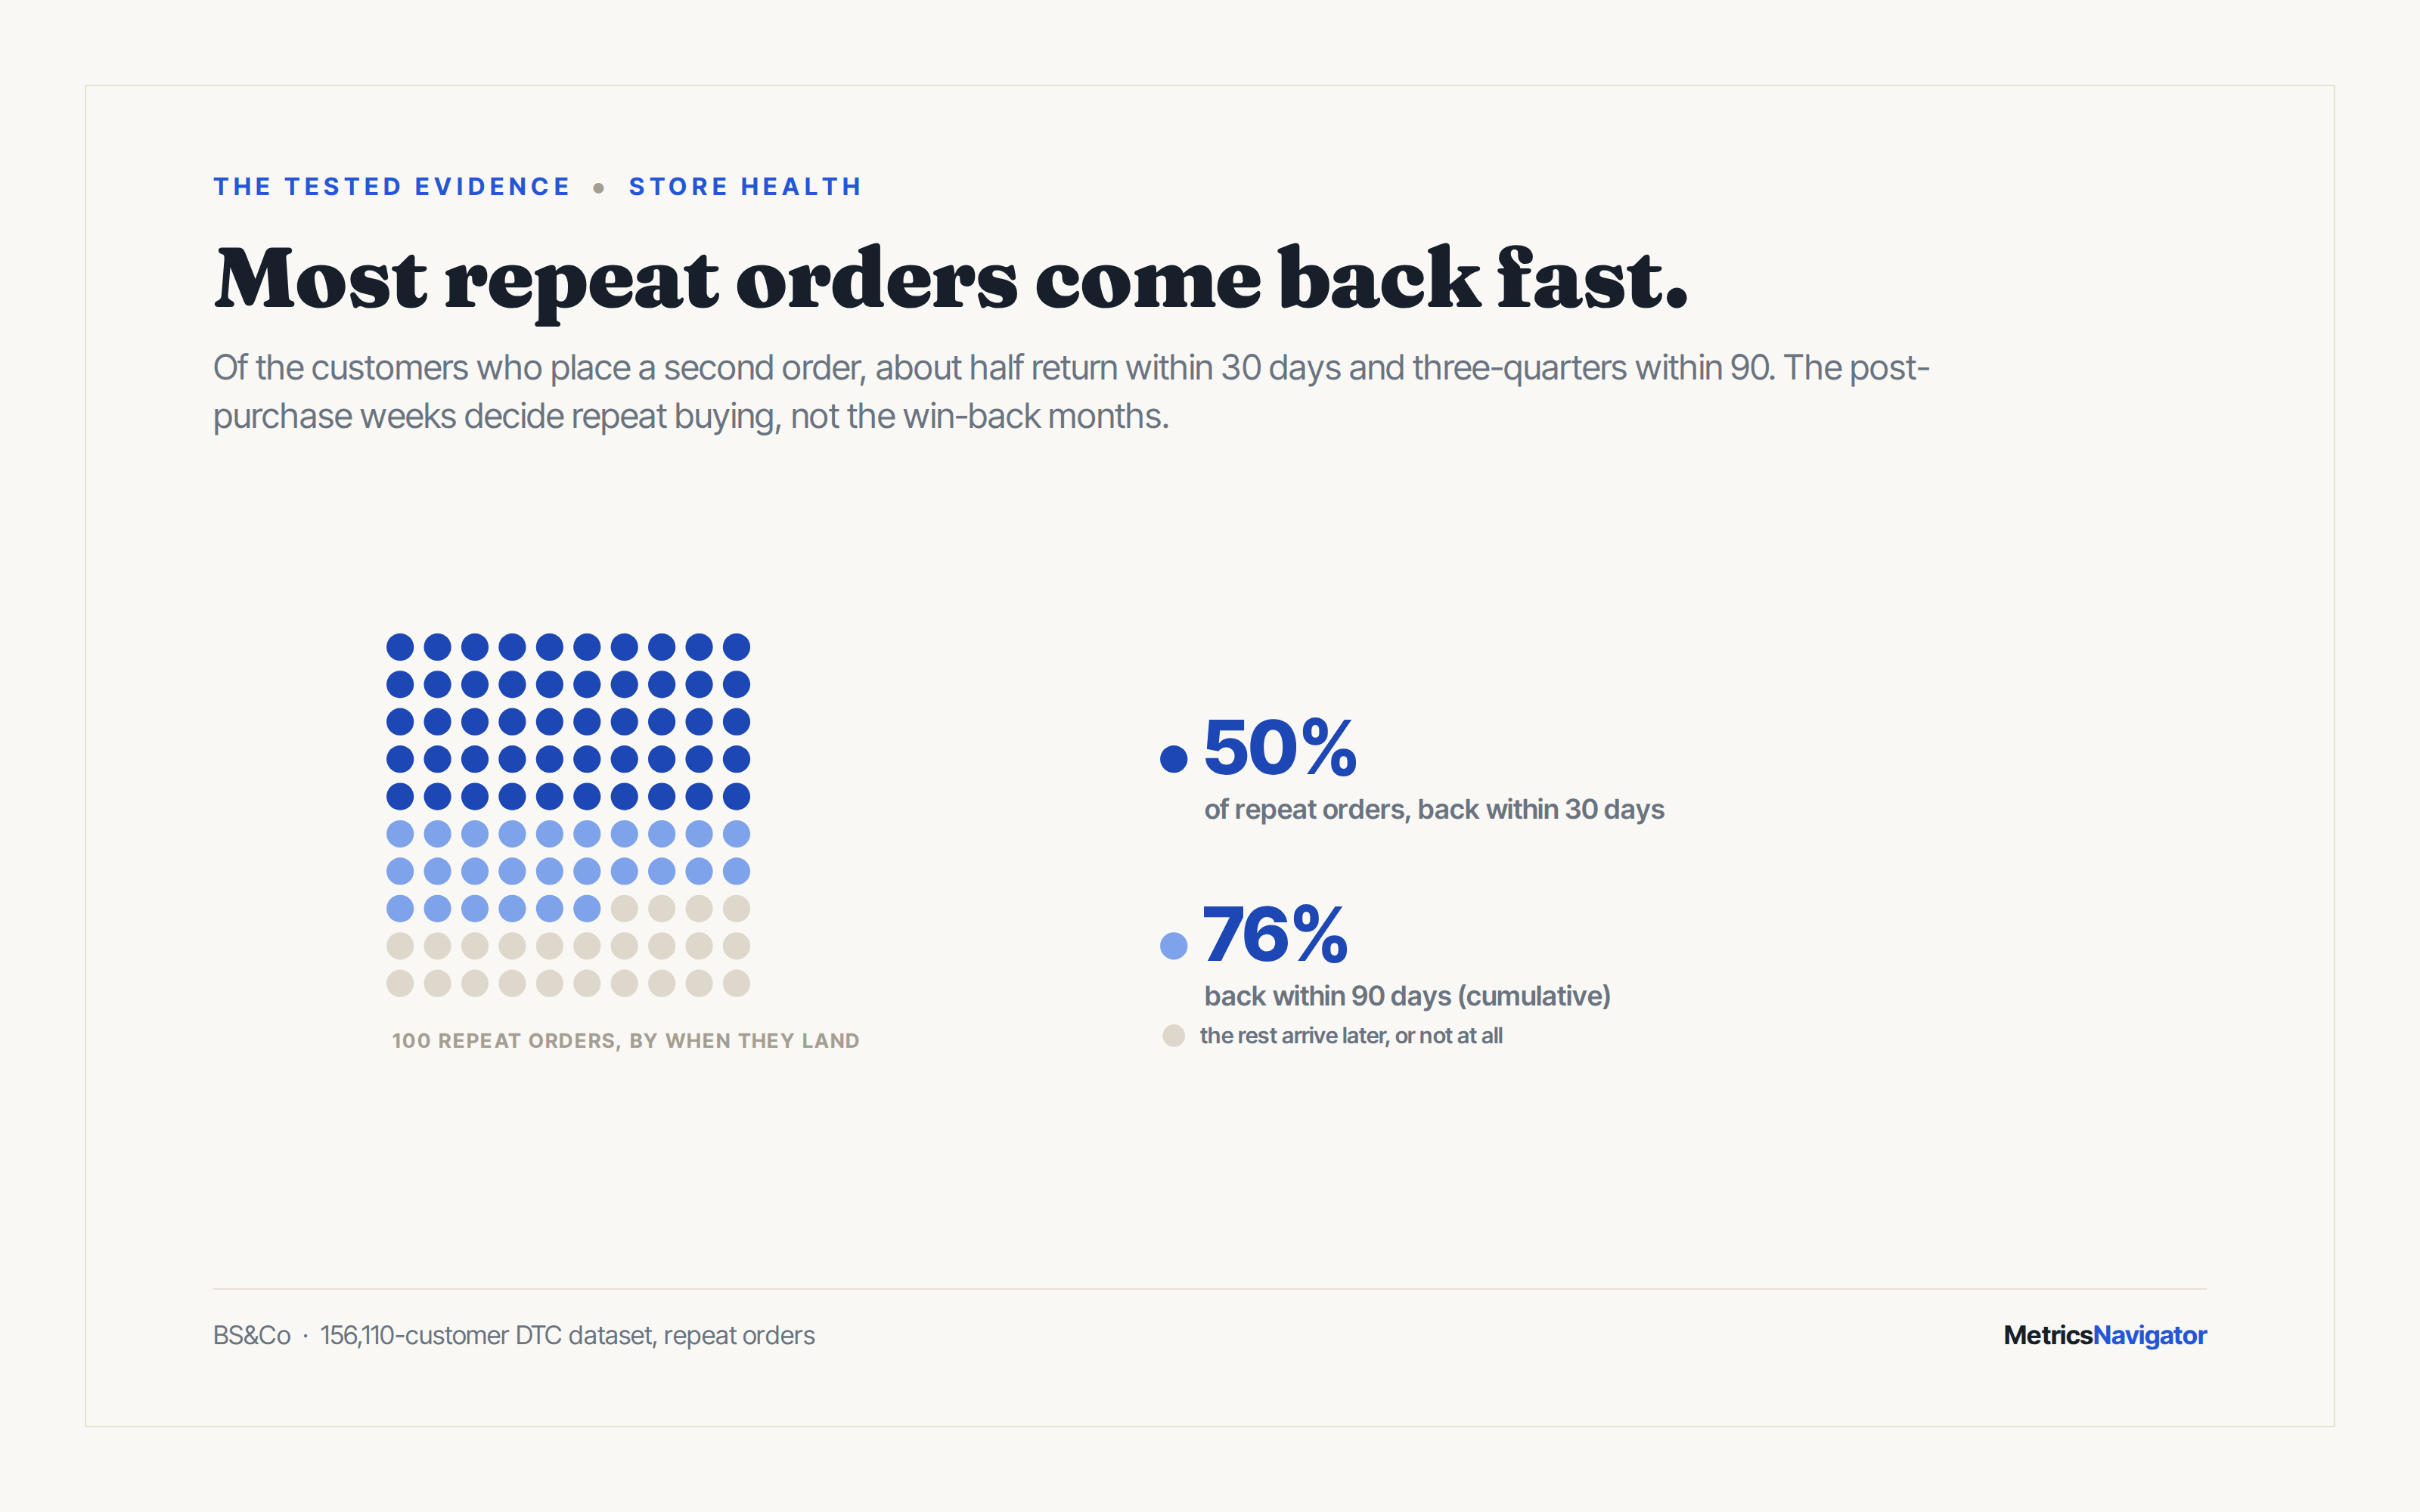
Most of the second orders that happen, happen fast. Of repeat orders in that dataset, 50.3% arrived within 30 days of the first and 76.4% within 90 (BS&Co). The post-purchase weeks, not the win-back months, are where repeat buying is won or lost, which is the subject of the repurchase comeback curve.
This is the acquisition question, and the honest form of it is contribution-margin payback: how many months of a customer's margin it takes to earn back what you paid to acquire them. Not the famous 3:1 LTV:CAC ratio. That target came out of SaaS venture guidance, and its popularizer David Skok describes it as an early guess he later checked against SaaS businesses, not stores (forEntrepreneurs). No ecommerce dataset validates 3:1.
Payback is harder to game because it forces you to name real contribution margin and real acquisition cost, and it tells you when the cash comes back, which is what constrains a store that is not venture-funded. The DTC norm operators watch is three to six months, with anything past twelve treated as risky.
If you want to raise the ceiling on what you can spend, retention does more work than margin or cost cutting. The canonical customer-value paper computed it: a 1% gain in retention raised customer value by 2.45 to 6.75%, a 1% gain in margin by about 1%, and a 1% cut in acquisition cost by only 0.02 to 0.32%, at a 12% discount rate (Gupta, Lehmann and Stuart, Journal of Marketing Research, 2004). In round terms, a point of retention is worth roughly five times a point of margin and up to a hundred times a point of acquisition cost. The full treatment, including why lifetime value has to be computed on contribution rather than revenue, is in the lifetime-value evidence file.
The new-versus-returning revenue mix is the share of a period's revenue that came from returning customers rather than first-timers. It is a different question from repurchase rate. Repurchase rate asks whether the base is healthy; the mix asks how exposed this month's revenue is to constant new acquisition.
Neither extreme is automatically wrong. Growing brands tend to grow more from acquiring new customers than from reducing defection, roughly twice as much in a large brand-growth study (Riebe et al., Journal of Business Research, 2014). A store leaning on new customers is not by itself unhealthy. But a store whose revenue holds up only because it keeps spending to replace customers who never return is renting its growth, and the rent shows up first in the payback number.
The mix has a companion: how concentrated revenue is among your best customers. Across 339 non-CPG public companies, the top 20% of customers delivered about 67% of sales, closer to a 70/20 rule than 80/20 (McCarthy and Winer, Marketing Letters, 2019). A healthy-looking mix can still sit on a thin set of repeat buyers, so read the mix and the concentration together. The cohort mechanics behind both are covered in reading retention honestly.
A store can pass the first four tests and still fail on the fifth, because healthy unit economics on paper are not cash in the bank. Growth consumes cash before it returns it, and the gap is where inventory sits and where the payback months are counted. This is the forward-looking number: the operating cash the store makes in a month, and how many months of it you hold.
The failures make the point. Allbirds kept a gross margin in the 40s and 50s the whole way down and still burned roughly $291M in operating cash across five years before a $39M asset sale (Eightx teardown of its SEC filings). Casper spent $422.8M on marketing between 2016 and late 2019 against roughly $357M in annual revenue and never turned a profit (from its S-1), and was later taken private at $6.90 a share, well below its $12 IPO price. Every one of those years carried a defensible-looking margin. The cash still ran out.
The operators who avoid this run a fixed review rhythm rather than a quarterly panic. Amazon's Weekly Business Review examines controllable input metrics ahead of output metrics like revenue, in a standing weekly meeting (documented in Working Backwards). At store scale, the wallet brand Ridge ran a Q4 on daily profit and cash-on-hand tracking, its CEO has said. The number to hold onto is plain: contribution dollars minus fixed costs is the cash the business makes, and cash divided by monthly burn is how long you have. Neither shows up on a revenue chart.
The benchmarks a “five numbers” article is tempted to reach for, and why they are not in the list above:
“It costs five times more to acquire a customer than to keep one.” No traceable primary study supports the 5x, or the 5-to-25x version. The oldest figure behind it is a 2003 Bain study of banking at about 4x, and the multiple swings with category and stage (trace-back via hashtagpaid; HBR repeats the line while citing nothing).
“A 5% lift in retention raises profits 25 to 85%.” That came from a 1990 Bain analysis that was a customer-value simulation, not a measured profit outcome. It assumed defection could be halved at no cost and computed the math (Reichheld and Sasser, HBR 1990). Cite it as an estimate, never as a law.
“3:1 LTV:CAC is the healthy benchmark for a store.” It is SaaS venture guidance its own author calls an early guess (Skok, forEntrepreneurs), and the widely shared “3:1 ecommerce average” rests on a sample that is 74% B2B (First Page Sage). Watch payback instead.
“Retention is always the highest-ROI lever.” Growing brands grow about twice as much from acquisition as from reduced defection (Riebe et al., 2014), and in one-and-done categories a repeat-rate target is the wrong goal entirely. Retention is a lever, not the lever.
“About 90% of ecommerce stores fail in the first 120 days.” The source is a 2019 UK PR survey with no published method, never replicated. Government data says roughly 80% of new US businesses survive year one and about half reach year five (BLS). The real base rate is sobering enough without the invented one.
ASK THE AI. Paste into ChatGPT or Claude with numbers you already know.
· “A typical order for my store is [AOV], my product cost is about [X]% of that, and I pay roughly [shipping cost] to fulfill it and [processing]% to process it. Work out my contribution margin per order after an estimated return and discount rate of [Y]%, and tell me how much is left to cover acquisition and overhead.”
· “Here are 90-day repeat rates for my last six monthly cohorts: [paste], and returning customers were [Z]% of last month's revenue. Tell me whether my base is getting healthier or just holding, and whether this month's revenue is riding on new acquisition.”
· “My contribution margin per customer is about [X], my blended acquisition cost is [Y], and I hold about [Z] months of operating cash. Compute my contribution-margin payback in months and tell me whether I can scale ad spend without running the cash down.”
There isn't one, but contribution margin per order is the floor. If a store loses money on each order, nothing else can rescue it, because retention and scale only multiply a negative number. Once that number is positive, health depends on the set: repurchase, payback, mix, and cash. No single figure captures a store on its own.
Payback, as the number you watch closely. LTV:CAC compresses too many assumptions into one ratio, and the famous 3:1 target is imported SaaS guidance with no ecommerce validation (Skok, forEntrepreneurs). Contribution-margin payback, the months of margin it takes to recover acquisition cost, is harder to inflate and tells you when the cash returns. The DTC norm is three to six months.
More often than most stores do. The operators who stay profitable run a fixed cadence rather than a quarterly review: Amazon's Weekly Business Review puts controllable input metrics ahead of revenue every week (Working Backwards), and some DTC operators track profit and cash daily. Cohort metrics move slowly, so monthly is a floor; cash and margin reward a weekly look.
MetricsNavigator computes these from your store's real order history when you connect your store.


