
Two of the most-repeated numbers in ecommerce trace back to no measured study: “a 5% lift in retention raises profits 25 to 85%,” and “it costs five times more to acquire a customer than to keep one.” One was a thought experiment. The other has no primary source at all.
That matters, because stores make real budget decisions on the strength of them. This is the evidence file for retention: what randomized experiments and published datasets actually show moves repeat buying, what turned out to be folklore, and how to measure the real thing on your own store. Every claim below names its source.
The short version: the marquee retention statistics are unsourced. The measured levers are narrower and more useful. Protect your existing customers from discounts, time your effort to the window before your repurchase curve flattens, and read retention on fixed cohorts, because a rising retention curve is usually survivor math rather than growing loyalty. Your own six-cohort trend beats any published benchmark.
Not as a law, and not by the number everyone cites. The “5 to 25 times more expensive to acquire than retain” claim has no traceable primary study. The oldest reference behind it is a single bank at roughly 4x, and industry, product, and business stage swamp any universal multiple (hashtagpaid's trace-back; HBR, 2014, which repeats the line while citing nothing).
The companion stat, “increasing retention 5% increases profits 25 to 85%,” comes from a 1990 Bain analysis that was a customer-lifetime-value simulation. It assumed defection could be halved at no cost and computed the math, not measured company profits. The widely-quoted “almost 100%” version is from Reichheld's later 1996 book, not the original article (Reichheld & Sasser, HBR 1990).
The honest version is more useful. Retention and acquisition are both worth managing, and the balance is measurable: across a large brand-growth study, growing brands grew about twice as much from acquiring customers as from reducing defection (Riebe et al., Journal of Business Research, 2014).
Retention is a lever, not the lever. Which one pays depends on your category. A one-and-done furniture store and a coffee subscription have opposite answers.
This is the cleanest result in the file, and it runs against instinct. In three randomized field experiments at a catalog retailer, the same deep discount had opposite effects depending on who received it.
For established customers, deeper discounts cut future purchasing: roughly 10% fewer units and, because those customers also traded down, about 20% less future revenue, $585 per customer versus $734 for the control.
For first-time buyers, the same depth raised future purchasing, by 14% in one experiment (a marginal effect) and a statistically significant 34% in another (Anderson & Simester, Marketing Science, 2004).
That study is the foundational one, and it is worth asking whether a two-decade-old result still holds. More recent randomized experiments confirm each half of it.
On the erosion side, a field experiment across more than 200,000 shoppers found that customers shown deeper discounts became about 22% more likely to buy on promotion later, at the same discount depth: discounting trains deal-sensitivity into the base (Elberg, Gardete, Macera & Noton, Quantitative Marketing and Economics, 2019).
On the acquisition side, across 70 randomized experiments, targeted discounts lifted spending about 37%, with 90% of the gain coming from purchases other than the discounted item, and the effect strongest among people who had not bought in the prior year: a discount works hardest as an acquisition tool (Sahni, Zou & Chintagunta, Management Science, 2017). One useful caveat from the same recent literature: the benefit to new customers is not unlimited, and introductory discounts deeper than about 35% can start to reduce retention rather than build it (del Rio Olivares et al., Journal of Marketing, 2018).
The mechanism is straightforward once you see it. A discount to a loyal customer teaches them to wait for the next one, and some share of them would have paid full price. A discount to a new customer buys a first habit.
So the blanket “20% off everything for everyone on the list” promo spends the discount in exactly the place it does measurable damage. The policy the evidence supports: aggressive introductory offers for first-timers, protected pricing for your base, and discounting held in reserve for customers your data says are genuinely gone.

Less than the member-versus-non-member numbers suggest, because those numbers are mostly selection. Heavy buyers join loyalty programs; the program didn't make them heavy buyers.
When researchers correct for that self-selection, the true share-of-wallet effect across seven Dutch grocery programs was “small, positive, and statistically significant,” real but a fraction of the raw gap (Leenheer et al., IJRM, 2007). A separate field study found the lift concentrated entirely in light and moderate buyers, with heavy buyers showing no behavior change after joining (Liu, Journal of Marketing, 2007).
And program effects vanish when roughly 75% or more of competitors also run one, which, in most categories, they now do (Bombaij & Dekimpe, 2020).
None of this means loyalty programs don't work. A well-run one produced a 6% storewide sales lift at roughly 400% ROI in a controlled test (Taylor & Neslin, 2005).
It means you cannot read your own program's “members spend 3x more” dashboard as proof it's working. Only a holdout test, members versus a comparable non-enrolled group, can tell you whether the program caused the gap or just labeled it. (Sources compiled in the Loyalty & Reward Co evidence review.)
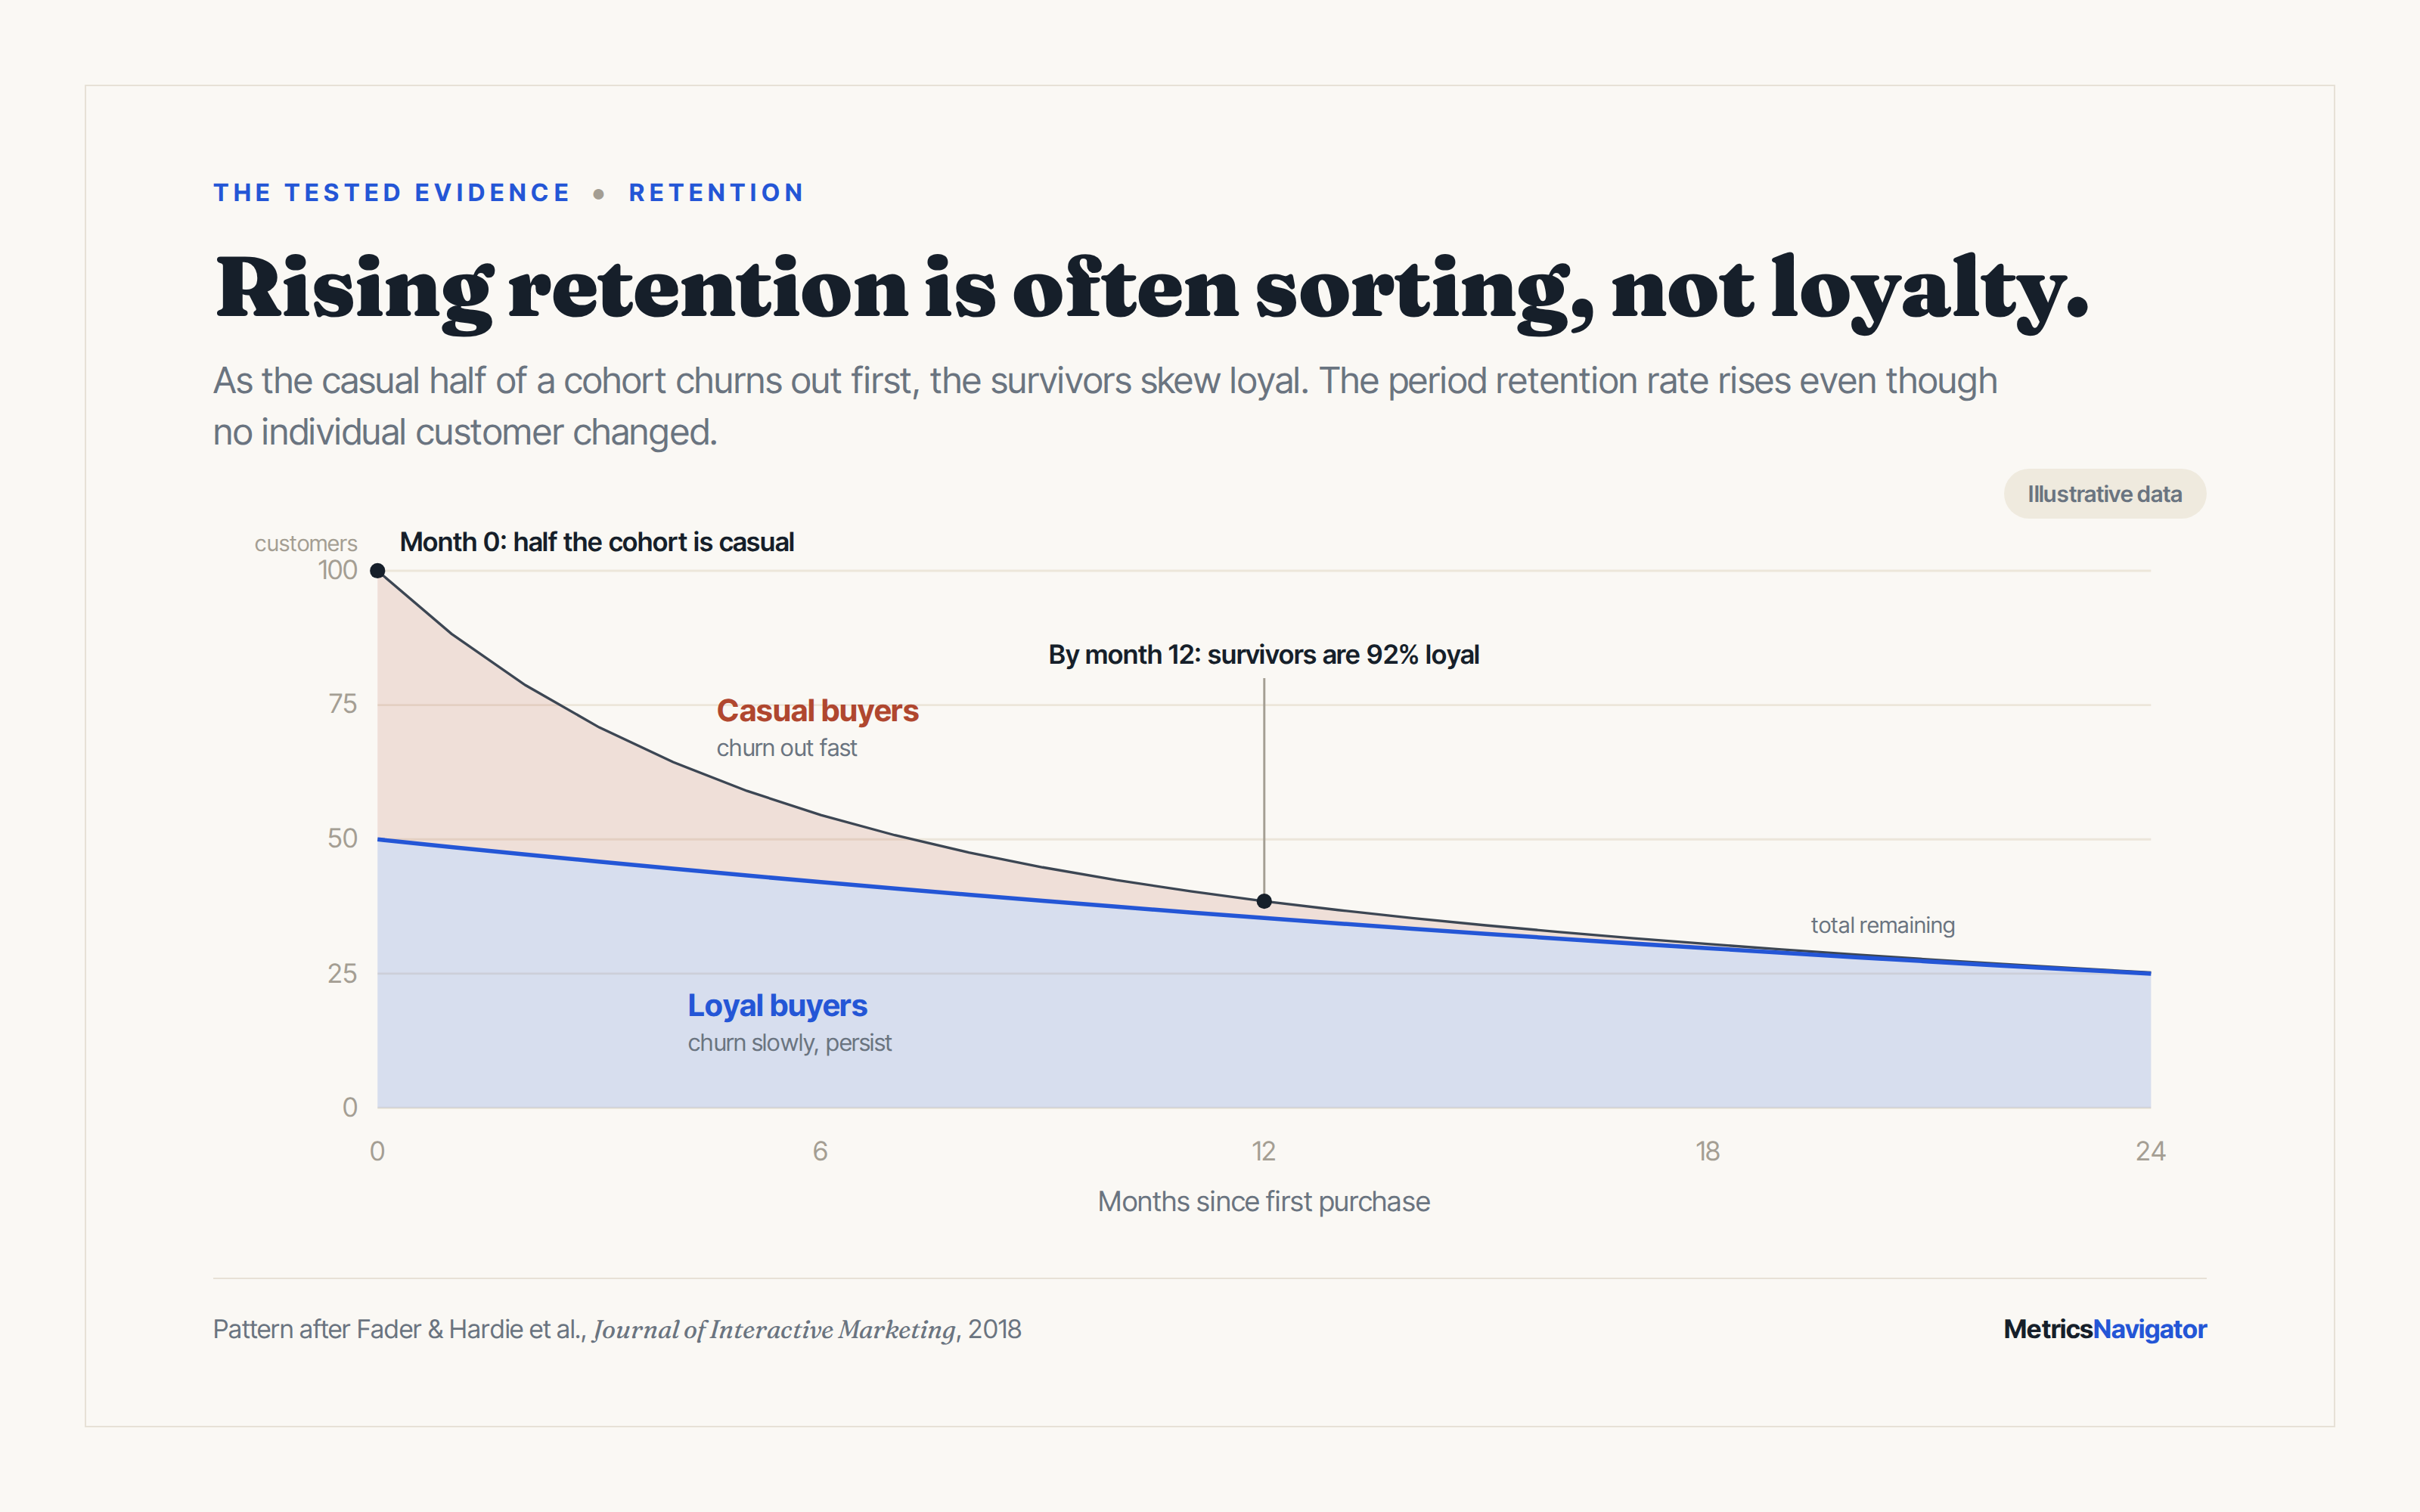
Here is the subtle one. Plot the retention rate of a single customer cohort over time and it appears to climb, as if customers get more loyal the longer they've been around. Most of that rise is an illusion.
In any group of customers, the high-churn ones leave first, so the survivors are increasingly the naturally loyal. The cohort's average retention rate rises even though no individual customer became more loyal. It is a sorting effect, not a behavior change (Fader & Hardie et al., Journal of Interactive Marketing, 2018).
This is the trap behind over-optimistic lifetime-value models. Extrapolate a cohort's “improving” early retention forward and you project a customer base that keeps getting stickier. The reality is that you are watching attrition concentrate the loyal, and the curve flattens.
The fix is to read retention on fixed cohorts at fixed windows and compare cohort to cohort. Is your March cohort's 90-day retention better than January's? That question is answerable. Watching a single cohort's rate drift upward and calling it progress is not.
You do not need a data-science team to read retention well. Two findings make that concrete.
First, a plain recency rule (“no order in N months means the customer is effectively gone”) classified active-versus-dead customers about as accurately as the sophisticated Pareto/NBD model across airline, apparel, and CD-retailer datasets, and beat it outright for the apparel retailer, 83% versus 75% correct (Wübben & Wangenheim, Journal of Marketing, 2008). The exotic model wins only for aggregate purchase-volume forecasting, not for the customer-level “is this person still a customer?” call operators actually make.
Second, in the RFM framework, recency does most of the work. It is the strongest predictor of future value, and, counterintuitively, a customer with many past orders but a long recent silence is more likely dead than a one-time recent buyer is (Fader, Hardie & Lee, JMR, 2005).
High frequency plus stale recency marks a lapsed VIP, not a loyalist. Sort your customers by recency first, and you have most of the signal.
ASK THE AI. Paste into ChatGPT or Claude, with numbers you already know:
· “My repurchase curve for a typical monthly cohort flattens around day [X]. Given that, where should I set the 'lapsed' cutoff for my store, and how should I sequence a win-back that finishes before customers are statistically gone?”
· “I want to know if my loyalty program actually works, not just whether members spend more. Design the simplest holdout test I can run, members versus a comparable non-enrolled group, and tell me what confound to watch for.”
· “Here are 90-day retention rates for my last six monthly cohorts: [paste]. Is the trend improving or decaying, how much could be seasonal, and what would I need to check to be sure it isn't a survivor effect?”
The section most retention articles can't write, because it requires checking the sources they cite. Claims that failed:
“A 5% increase in retention increases profits 25 to 85%.” A 1990 customer-value simulation, not a measured profit outcome; it assumed defection could be halved at zero cost. (The inflated “up to ~100%” version circulating online comes from Reichheld's 1996 book, not the original.) Cite it as “Bain estimated,” never as a measured law (Reichheld & Sasser, HBR 1990; critique in Ehrenberg-Bass's Loyalty Myths).
“It costs 5 to 25 times more to acquire than to retain.” No traceable primary study; the line propagates from secondary citations that reference nothing. The oldest supporting figure is a single company at about 4x (hashtagpaid trace-back).
“Loyal customers are cheaper to serve and more profitable.” Measured the opposite in four industries: the loyalty-to-profitability correlation was weak (about 0.3), roughly half of “loyal” long-tenure customers were barely profitable, and loyal customers often paid less and demanded more service (Reinartz & Kumar, HBR 2002).
“Customers have a 27% chance of returning after one purchase, 49% after two, 62% after three.” Traceable only to vendor blogs citing a defunct analysis with no published dataset or method. Category variance alone, supplements repeating far more than furniture, makes a single universal curve meaningless.
“Our loyalty members spend 2 to 3x more, so the program works.” Pure selection: heavy buyers join programs. The measured causal lift after correcting for self-selection is small, and zero for heavy buyers. A scale fact like “80% of transactions come from members” says nothing about incrementality.
There is no single healthy number. A 30-day-use consumable should see repeat orders inside a month; a durable-goods store may see a healthy customer return after a year; and published averages blend the two into a figure that describes neither. Measure your last six monthly cohorts at a fixed window and read the trend. Three consecutive falling cohorts is a signal to act, whatever the absolute level.
Sometimes, but not as a reflex. The randomized evidence shows discounts erode future purchasing among your established customers, so reserve the aggressive offer for customers your data says are genuinely lapsed, and lead with product, a restock or a new arrival, for those who are merely quiet. Discounting a customer who would have returned at full price just transfers your margin to them.
It can be. A controlled test showed a 6% storewide lift at roughly 400% ROI. But you can only know by testing your own with a holdout group. The “members spend more” number on your dashboard is selection, not proof. If most of your competitors already run programs, expect the incremental effect to be small.
MetricsNavigator builds your retention cohorts, repurchase curves, and customer-recency segments from your store's real order history when you connect your store. The measurements above, without the spreadsheet.


