
Two stores each bring in 200 new customers in March. In one of them, 30 buy again within a month. In the other, 12. Nothing in the ad account or this month's revenue report shows the difference, but six months out the first store gets a growing share of its orders with no acquisition cost attached, and the second is paying to win nearly every order again. The number that separates them is repurchase rate: the share of first-time customers who come back for a second order.
The short version: repurchase rate is the share of first-time customers who order again within 30, 60, or 90 days. Measure it on cohorts old enough to finish the window, find where your curve flattens, and put your retention effort inside that window. Your own six-cohort trend beats any published benchmark.
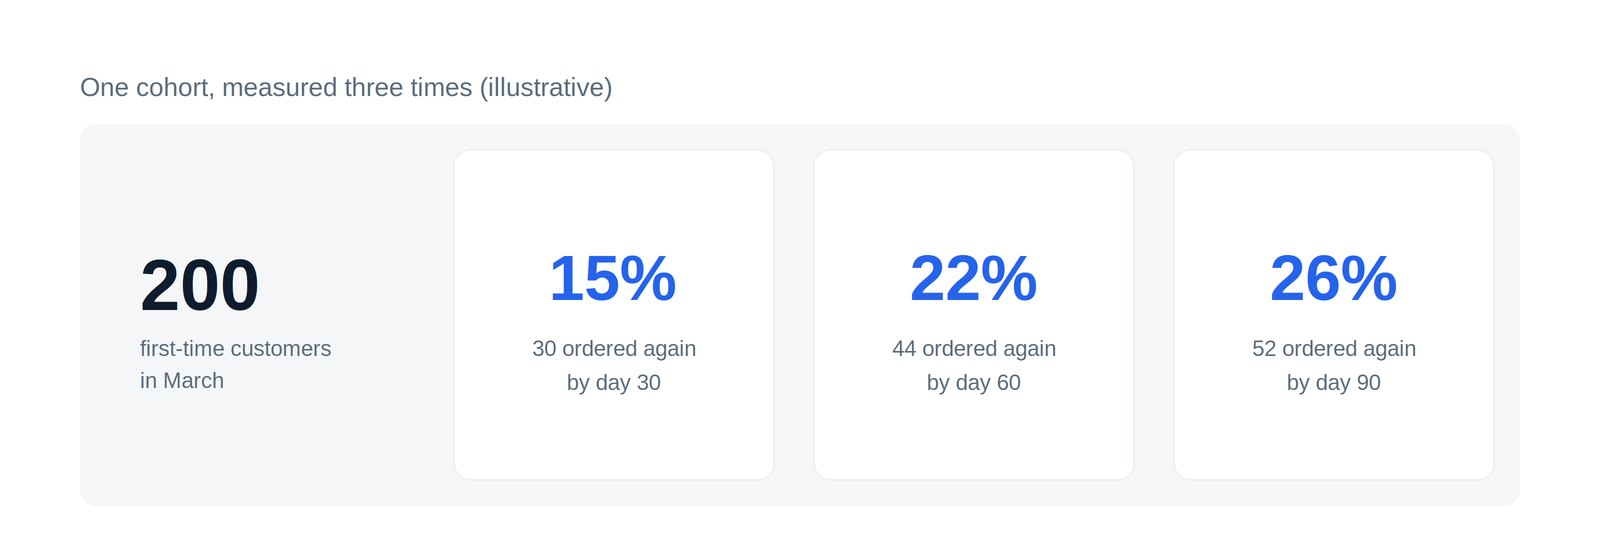
Take everyone whose first order landed in the same month and plot the share who have ordered a second time, by days since that first purchase. You get a curve that climbs fast in the early weeks and then flattens. In the illustrative store above, it reaches 15% by day 30 and 26% by day 90, and past day 90 it barely moves.
The flattening point matters as much as the height. It tells you when a customer who hasn't returned is probably not going to. A store whose curve goes flat at day 45 has a 45-day window to give people a reason to come back; spending on winback campaigns at day 120 is mostly spending on the departed.
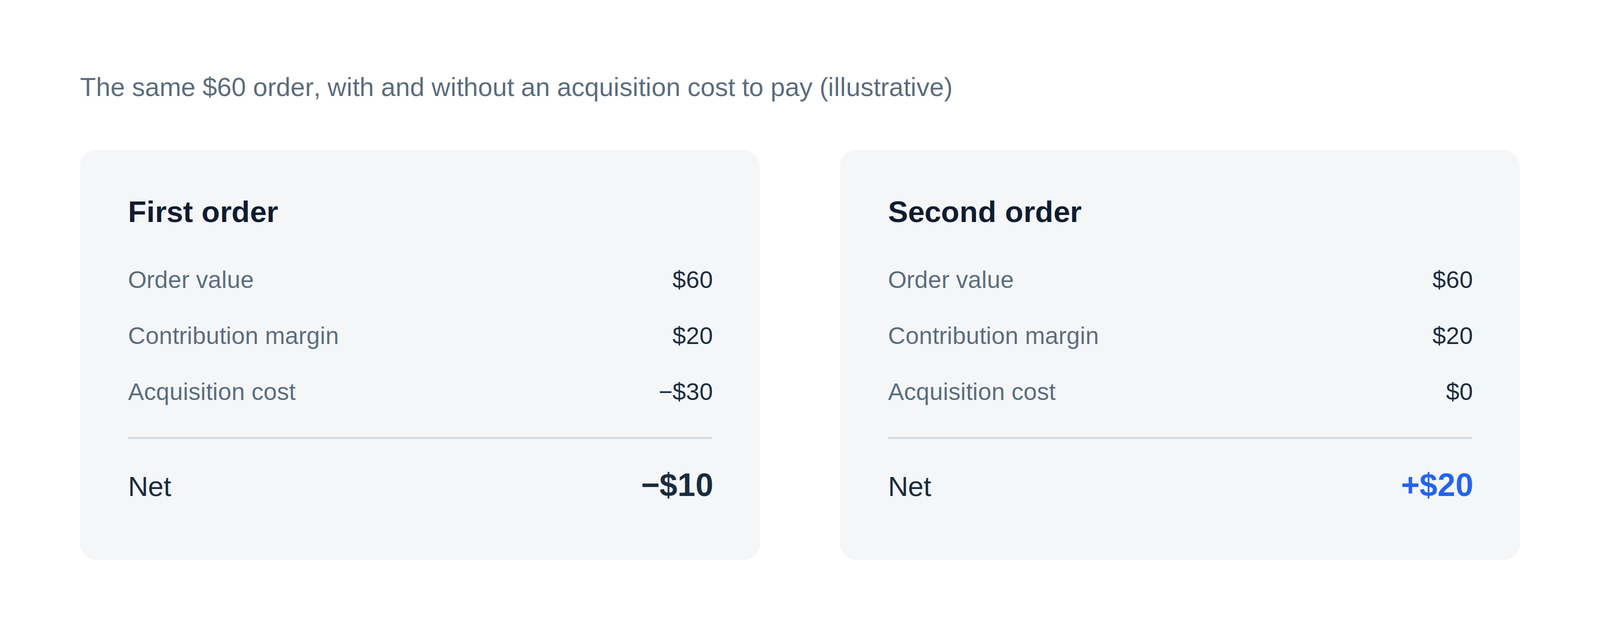
The reason to watch this number before the others is arithmetic. Say you pay $30 to acquire a customer and clear $20 of contribution margin on a $60 order. The first order loses $10. The second order, which cost you nothing to acquire, makes $20. Repurchase rate is the number that decides whether your marketing budget is buying customers or just renting orders one at a time. The other half of that arithmetic — how much each order is worth — has its own tested playbook: what actually raises average order value.
You need order history and a spreadsheet, nothing else. It takes about ten minutes.
First, pick a cohort old enough to be measured fairly: every customer whose first order was between 90 and 180 days ago. Each of them has had a full 90 days to come back, so the measurement is complete rather than still in progress. Then count how many placed a second order within 30, 60, and 90 days of their first. Repurchase rate is that count divided by the cohort's size.
Using the illustrative store from the chart: 200 first-time customers in March. By day 30, 30 of them had ordered again (15%). By day 60, 44 (22%). By day 90, 52 (26%). Those three points are enough to sketch your curve and see where it starts to flatten.
Repeat this for your last six monthly cohorts and you have something more useful than any published benchmark: a trend. A store moving from 18% to 22% at day 90 is getting structurally healthier even if some blog post says the average is higher.
The most common one is computing repurchase rate across your whole customer base for all time. That mixes five-year-old loyalists with people who bought last week, and the loyalists inflate the number until it stops meaning anything. Always measure a cohort against a fixed window.
The second is including customers too recent to have had a fair chance. If someone first ordered 20 days ago, they can't have a 90-day repurchase outcome yet. Counting them drags the rate down and makes recent months look artificially bad.
And be careful with cross-category comparison. A coffee brand should see repurchases inside 30 days because the product runs out. A furniture brand may see a healthy customer return after a year. Neither store learns much from the other's number, which is one more reason your own cohort trend beats a generic benchmark.
The window between the first purchase and your curve's flattening point is where effort pays. Two levers I'd start with:
A post-purchase email sequence timed to land inside that window, built around use of the product rather than a coupon. If your curve flattens at day 45, an email on day 60 is too late no matter how good it is.
A reason to return that isn't a discount. Replenishment reminders for consumables, a second-product recommendation based on the first order for everything else. Blanket winback discounts have a hidden cost: some share of recipients would have returned at full price, and the coupon just transfers margin to them. The randomized-experiment evidence on who discounts actually help — first-time buyers, not your established base — is collected in the AOV evidence file. I'd hold discounting in reserve for cohorts the data says are truly gone.
You can get useful analysis on this today with a general AI tool and the numbers you already have. Nothing needs to be exported or connected. Paste any of these into ChatGPT or Claude:
I run a Shopify store selling [category] with an average order value of [$X]. Of customers whose first order was at least 90 days ago, [Y]% ordered again within 90 days. Walk me through whether that's healthy for my category and price point, and what I should check before comparing myself to any published benchmark.
My repurchase curve flattens around day [X]. Design a post-purchase email sequence timed to that window: how many emails, on which days after the first order, and what each one should cover. No discount offers.
Here are 90-day repurchase rates for my last six monthly cohorts: [paste the six numbers]. Tell me whether the trend is improving or decaying, how much of it could be seasonal, and what I'd need to look at to be sure.
There isn't one healthy number. Consumables with a 30-day use cycle should see repurchases inside a month, durable goods can take a year, and published averages mix both together. Treat good as relative: measure your last six monthly cohorts at 90 days, and read the trend. Three consecutive falling cohorts is a signal to act, whatever the absolute level.
Not quite. Repeat customer rate is usually computed across every customer a store has ever had, which mixes long-time loyalists with last week's buyers. Repurchase rate, as used here, is cohort-based: one month's new customers, tracked over a fixed window. The cohort version is the one that can tell you whether things are getting better or worse.
Measure all three, then let your own curve decide. The window that matters is where your curve flattens, because that's how long a customer stays winnable. Most retention effort belongs before that point.
If you'd rather skip the spreadsheet step entirely, MetricsNavigator runs this math on your store's real order history when you connect your store, and keeps the cohorts up to date from then on. The manual method above gives you the same answer with more clicks.


