
Most advice about raising average order value has never been tested by the people repeating it. When someone runs the experiment, a surprising amount of it fails — and some of the standard playbook turns out to be backwards. This is the evidence file: what survived randomized tests and published datasets, what didn't, and how to run the numbers on your own store. Every claim below names its source.
The short version: there is no universal free-shipping rule — diagnose what share of your orders already ships free, then test in the direction that number suggests. Spend discounts on first-time buyers, never on your established base. Offer bundles alongside individual products, never instead of them. And judge every tactic on contribution per order, not AOV alone.
The folklore says to set your threshold about 30% above AOV. No published test supports that multiplier, and the two best-documented experiments moved in opposite directions.
A sports-equipment brand with a $650 AOV had its threshold at $100 — over 85% of orders were already shipping free, which meant the store was paying for shipping it didn't need to subsidize. Raising the threshold to $500 lifted conversion 5.5%, AOV 6%, and revenue per visitor 12% in a 50/50 split test (Intelligems). Raising a threshold improved conversion — the opposite of what most operators would predict.
The reverse trade is just as real. A beverage brand that introduced a $50 threshold where shipping had been free on everything gained 6.5% AOV and 3% monthly revenue, and paid 3.5% conversion for it (Intelligems). Both cases are disclosed A/B tests published by the testing platform that ran them — worth knowing, though the direction-finding logic holds either way. And the academic literature warns that threshold promotions can be net-unprofitable outright once forgone shipping revenue is counted (Lewis, Singh & Fay, Marketing Science, 2006).
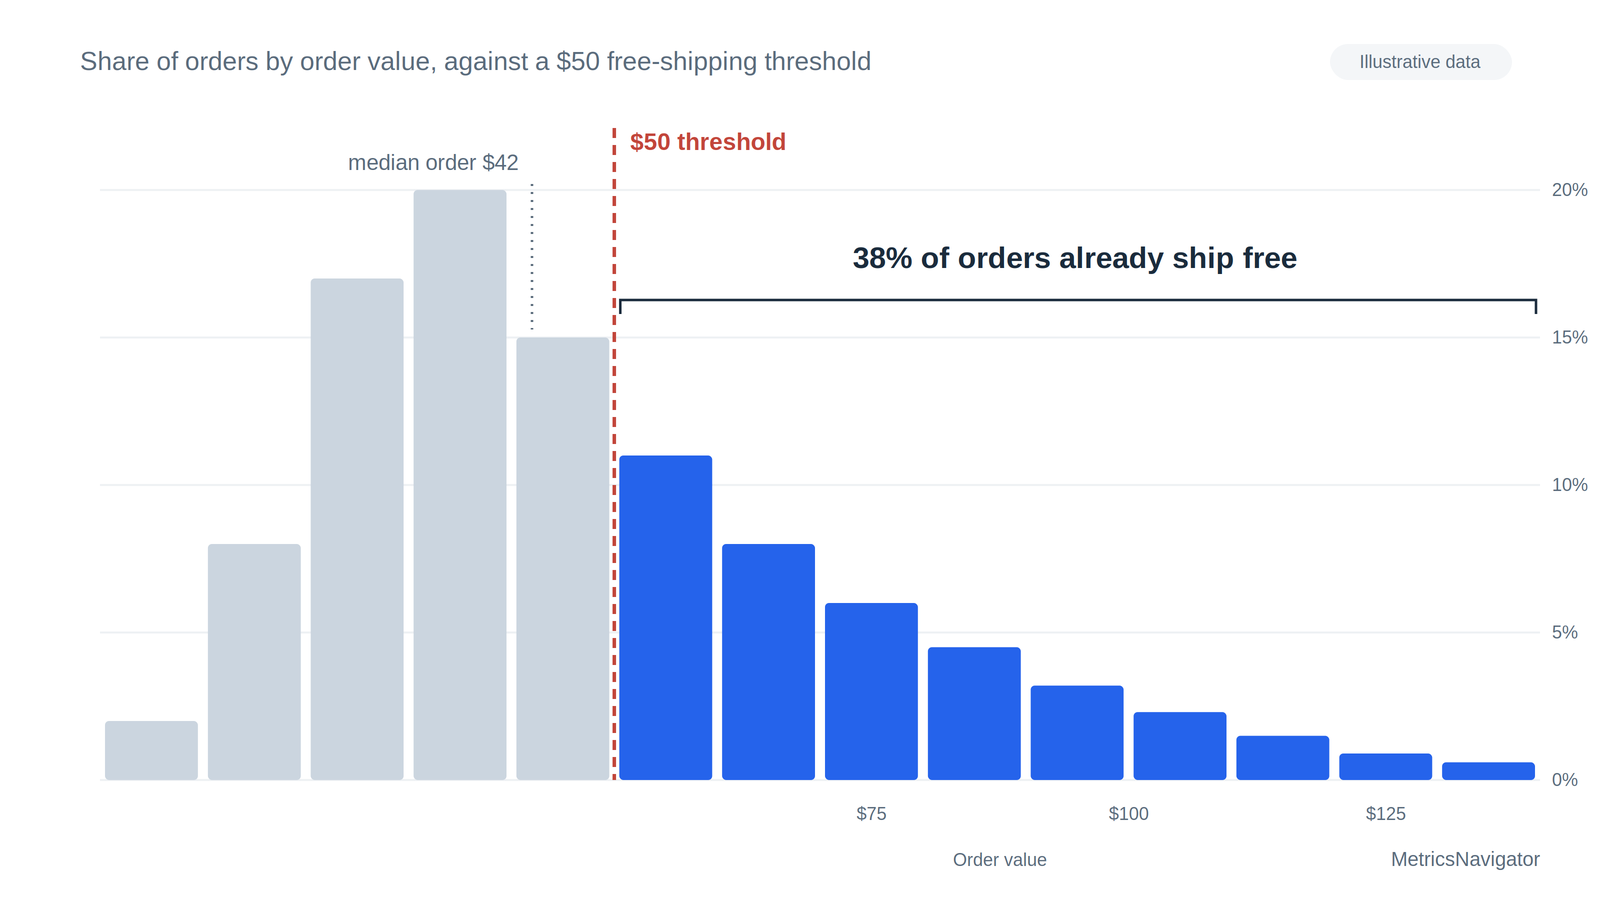
The working diagnostic: what share of your orders already ships free? Very high, and you're subsidizing orders that needed no incentive — test raising. Very low, and the bar may be too far above your typical order to pull anyone up — test lowering. One related result, with a caveat: an agency A/B test that introduced a dynamic "you're $X away from free shipping" banner together with a threshold increase saw AOV rise about 10%, while a static banner alone moved conversion (+3.1%) but not AOV (Swanky). The banner and the threshold changed together, so the 10% can't be credited to the banner alone — but the static-banner null is a hint that the dynamic form is what matters.
No — and the cost lands unevenly. In three randomized field experiments at a catalog retailer, deeper discounts cut future purchases by established customers by about 11% (a 56,000-customer experiment) while increasing future purchases by first-time buyers (tested on samples up to roughly 300,000) — Anderson & Simester, Marketing Science, 2004. Discounts teach your loyal customers to wait for the next one; they teach new customers that your store exists.
The policy that follows: aggressive introductory offers, protected pricing for the base. Most stores run the opposite — blasting sitewide promos at everyone on the list, which spends the discount where it does measurable damage.
A five-year study of Nintendo's handheld business modeled what would have happened under different bundling regimes. In the authors' counterfactual simulations, selling bundles as the only option cut revenue by more than 20% versus mixed bundling — offering the same bundle alongside the individual items (Derdenger & Kumar, via HBS Working Knowledge). Strikingly, consumers valued the bundle less than the sum of its parts, and mixed bundling still won — because it let price-sensitive and premium buyers each find their own path. The rule: never make a bundle the only way to buy.
Bundle quality matters as much as structure. Baymard's audits found 52% of desktop e-commerce sites show cart cross-sells that are irrelevant or purely generic "others bought" suggestions — and their testing shows a single bad recommendation makes users distrust all of them (Baymard). Complementary items ("goes with what's in your cart") outperform alternative products, which read as second-guessing the shopper.
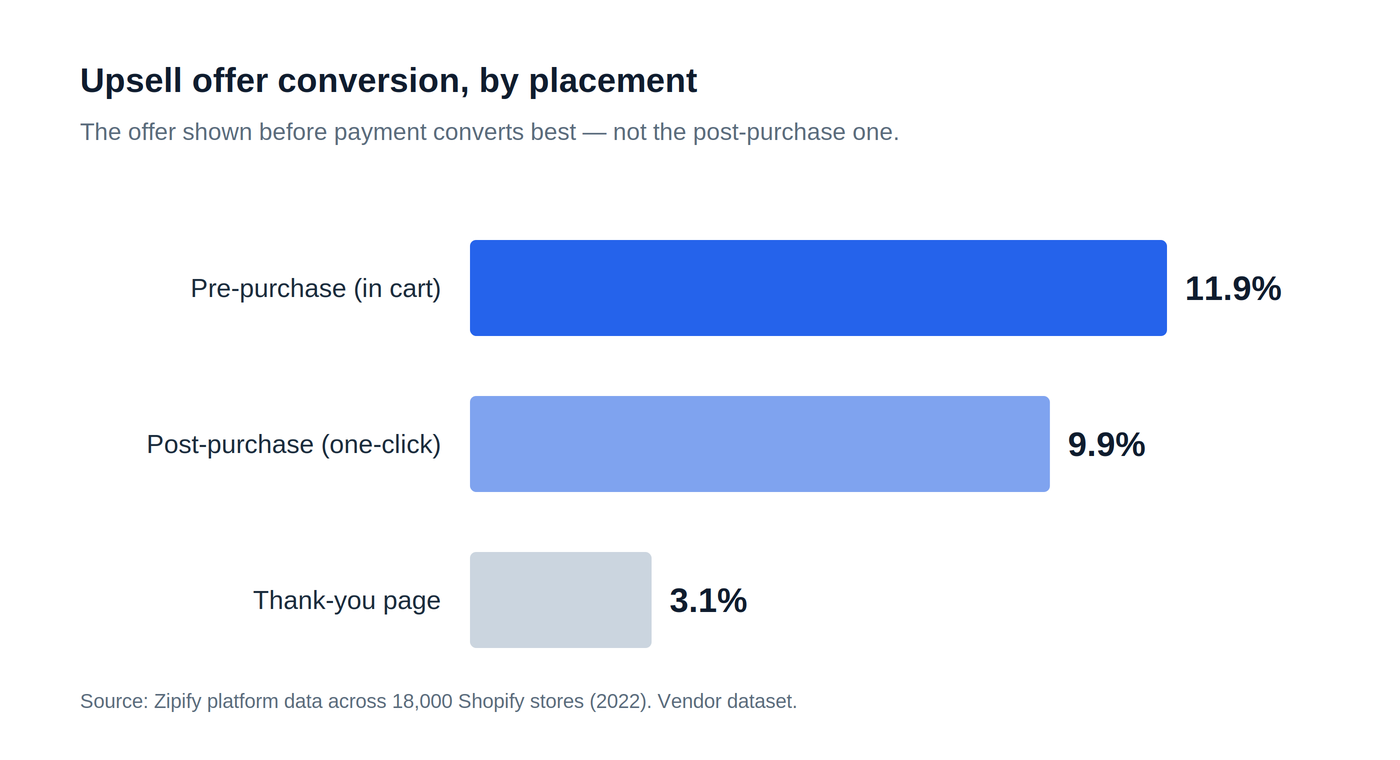
The one-click post-purchase offer — shown after payment, before the thank-you page — is real, nearly free money, because it structurally cannot hurt checkout conversion: the sale is already closed. But the honest numbers are smaller than the app-store marketing. Across 18,000 Shopify stores, upsell revenue averaged about $1,435/month per store — and note that's a mean, so it's skewed upward by big stores, the same distortion this post warns about below (Zipify platform data — vendor data, but the largest placement comparison we found). The same dataset's surprise: pre-purchase offers converted higher (11.9%) than post-purchase (9.9%), with thank-you-page offers a distant third (3.1%).
In an 86-store field experiment across 13 products, the identical discount produced a roughly one-third larger sales lift when framed as a multiple-unit price ("2 for…") than as a single-unit price — +165% versus +125% over baseline (Wansink, Kent & Hoch, Journal of Marketing Research, 1998; independently corroborated and extended by Manning & Sprott, Journal of Retailing, 2007). Multiple-unit framing moves the mental anchor from one unit to two. The follow-up lab work on purchase intentions found anchors show diminishing returns — an 8-unit frame beat a 2-unit frame, but a 20-unit frame did no better than 8. Two or three is the working range; it costs nothing to test.
This is the section most AOV articles can't write, because it requires checking. Claims that failed:
"Set your threshold 30% above AOV." No published test supports any universal multiplier; the documented optima above went in opposite directions.
"BNPL raises AOV 45–85%." Providers have claimed lifts in that range (Klarna and Affirm figures, via CNBC) — but they compare customers who chose financing against those who didn't, and bigger carts choose financing, not the reverse. The independent estimate is a 30–50% ticket lift (RBC Capital Markets, via CNBC), and the causal academic finding is about $60/week of additional total spending from BNPL access (Di Maggio, Katz & Williams, HBS). Worth offering — but budget on the smaller number, and know the CFPB found nearly two-thirds of BNPL loans go to lower-credit-score borrowers, and that 63% of all BNPL borrowers took out multiple simultaneous loans at some point during the year (CFPB, 2025).
Decoy pricing. Adding a deliberately unattractive option to steer buyers to the premium tier replicates in labs with abstract choices — and repeatedly fails with real products and real photos (Frederick, Lee & Baskin, JMR, 2014). Its defensible cousin is the compromise effect: in a genuine good-better-best lineup, the middle option gains share (Simonson & Tversky, JMR, 1992).
"35% of Amazon's revenue comes from recommendations." Untraceable to any Amazon disclosure — it originates as an outside analyst estimate from 2013, endlessly re-cited since. "Post-purchase upsells add 10–20% AOV for a typical store." App marketing; the platform data above says otherwise.
Three disciplines make the difference between testing and guessing. First, judge on contribution per order — revenue minus product, shipping, fulfillment, and processing costs — never on AOV alone; an AOV lift bought with discounts or free shipping can shrink what you keep. Second, watch the median, not just the mean: a single large customer distorts the average (RetentionX's documentation illustrates it with a nine-customer example where one $1,200 customer pushes the mean 37% above the median). Third, control for mix: mobile orders average roughly $137 against desktop's $146–$204 (Dynamic Yield benchmarks, cited by Triple Whale), so a channel or device shift can masquerade as an AOV trend.
A worked example of a clean test (illustrative): say your median order is $42 and 38% of orders ship free over your $50 threshold. The diagnostic says the threshold is close to your natural order size and the share is middling — test raising to $65 against the $50 control, split 50/50, and decide on contribution per visitor after two weeks, not on AOV.
ASK THE AI — paste into ChatGPT or Claude, with numbers you already know:
· "My AOV is [$X], my free-shipping threshold is [$Y], and roughly [Z]% of orders ship free. Should I test moving the threshold up or down, and how do I judge the result on profit per visitor rather than AOV alone?"
· "Design a discount policy that follows this evidence: introductory offers can raise first-time buyers' future purchases, but deep discounts reduce repeat buying among existing customers. My current promos: [describe]."
· "Here are ten products from my catalog: [paste]. Which suit '2 for' multiple-unit pricing, and what anchor quantity for each?"
Is a higher AOV always good? No. AOV bought with discounts can cost more in margin and future purchases than it adds, and AOV bought with a too-high threshold costs conversion. The number that settles it is contribution per order alongside conversion — if both hold or rise, the AOV gain is real.
Should I add BNPL to raise AOV? As a payment option, reasonably — some customers prefer it, and the causal spending effect is positive. As an AOV strategy budgeted on the vendors' 45–85% claims, no; those numbers describe selection, not lift.
What share of my orders should get free shipping? There's no published universal answer. The documented cases found their optimum by testing in the direction the current share suggested — one raised its threshold with 85% shipping free, one introduced a threshold where 100% shipped free. Measure yours first.
MetricsNavigator computes your AOV, median order, contribution per order, and where orders cluster from your store's real history when you connect your store — the measurements above, without the spreadsheet.


